Competitive Exam

Logical Venn Diagram question bank (Reasoning)

Practice 42 free Competitive Exam Reasoning - Logical Venn Diagram questions with answers and step-by-step solutions.

Q1.

Consider the Venn diagram given below. The numbers in the Venn diagram indicate persons reading the newspapers. The diagram is drawn after surveying $50$ persons. In a population of $10,000$,how many can be expected to read at least two newspapers? Choose the correct answer from the following:
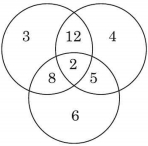
figure

(A)
$5000$
(B)
$6250$
(C)
$6000$
(D)
$5400$
Show answer & solution
Verified Answer & Solution Locked
Sign in to your free student account to reveal verified answers, instant hints, and detailed explanations.
Sign in to view
Q2.

Advanced Research & Methodology: In scholarly analysis of 'Logical Venn Diagram', which methodological approach ensures reproducibility and minimizes systematic bias?

(A)

Controlled multi-factorial experimental design with blinded statistical validation (Logical Venn Diagram)

(B)

Post-hoc selective data reporting highlighting only conforming sample sets

(C)

Uncalibrated qualitative impressions without standardized measurement criteria

(D)

Extrapolating microscopic laboratory observations directly to macro ecosystems without validation

Show answer & solution
Verified Answer & Solution Locked
Sign in to your free student account to reveal verified answers, instant hints, and detailed explanations.
Sign in to view

Sign up free to access all 2 questions

Unlock every Logical Venn Diagram question, generate papers, and practice at your own pace.