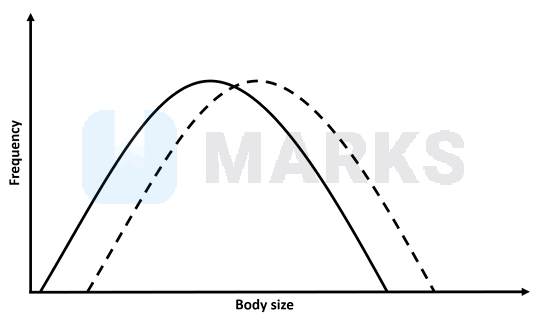
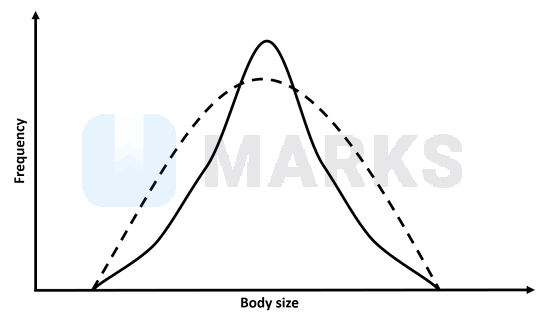
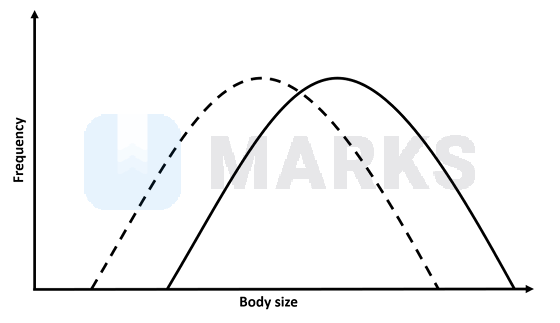
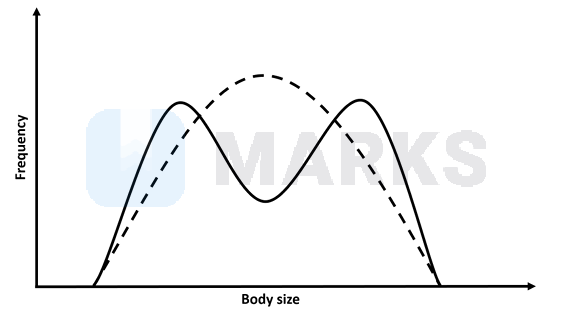
The following plots represent the body size distributions of a fruit fly population. Dashed lines represent the ancestral distributions and continuous lines represent the distributions after a few generations. If the larger individuals have better survival as well as higher reproductive rates, which diagram below best represents the expected change in the distribution of body size (X-axis represents body size while Y-axis represents frequency)?
Engineer & Medical
Evolution question bank (Biology)
Practice 8 free Engineer & Medical Biology - Evolution questions with answers and step-by-step solutions.
Q1.
Verified Answer & Solution Locked
Sign in to your free student account to reveal verified answers, instant hints, and detailed explanations.
Q2.
A population of finch birds with medium sized beaks colonizes an island with plants producing medium and large sized seeds. After a disease wipes out all the plants with medium sized seeds, what is most likely to happen to the finches?
Show answer & solution
Verified Answer & Solution Locked
Sign in to your free student account to reveal verified answers, instant hints, and detailed explanations.
Protected Questions
Unlock All 3 Questions in Evolution
Log in or sign up free to access every question with complete solutions, create chapter practice tests, and track your performance.
Sign up free to access all 3 questions
Unlock every Evolution question, generate papers, and practice at your own pace.