Q1.
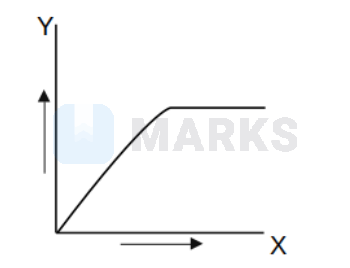
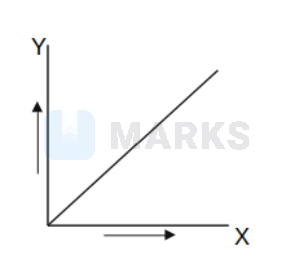
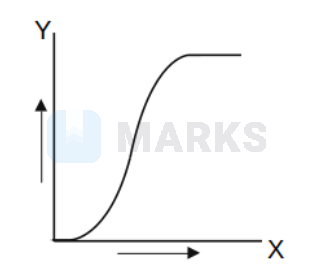
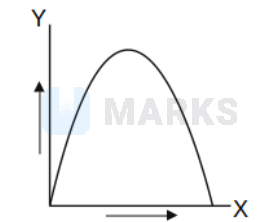
Which of the following graphs represents the correct relationship between light intensity ( X -axis) and the rate of photosynthesis (Y-axis)?
(A)
(B)
(C)
(D)
Show answer & solution
Verified Answer & Solution Locked
Sign in to your free student account to reveal verified answers, instant hints, and detailed explanations.